Water & Equity Mapping Tools
We depend on accurate and pertinent information to address environmental pollution and issues of environmental justice to improve both public health and the health of our waterways. Data helps answer questions like:
- Does your community suffer from chronic exposure to leaking underground storage tanks?
- Are harmful contaminants prevalent in your drinking water system?
- Which communities are most likely to bear the brunt of climate change-induced natural disasters?
Environmental justice advocates have long sought to increase transparency related to permitting decisions, the cumulative impacts of pollution to the air, land, and water, and how demographics- particularly of race and class- interact with environmental factors. The federal government and some states have developed mapping tools to inform governmental agencies, private industry, and the public about the prevalence of different types of exposure to environmental pollution. These tools can advance equity if used in decision-making processes.
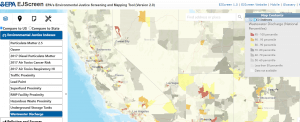
EJScreen 2.0
The US Environmental Protection Agency (EPA) first began using “EJScreen” in 2012 and it opened to the public in 2015. The mapping tool includes three kinds of information: demographic indicators, environmental indicators, and EJ indexes, which summarize the interplay between environmental and demographic indicators in a given location. In early 2022, EJScreen 2.0 launched, featuring updated health metrics such as life expectancy, asthma, and heart disease, and new data on drought and wildlife.
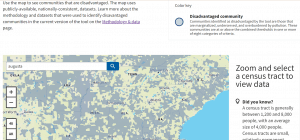
Climate & Economic Justice Screening Tool
The White House Council on Environmental Quality (CEQ) launched the Climate and Economic Justice Screening Tool (CEJST) in public beta form in February 2022 as directed by President Biden’s Executive Order 14008. The 1.0 version of the tool was released in November 2022. The CEJST, like EJScreen, includes demographic and environmental indicators, though it does not include race/ethnicity as an indicator. The tool was designed in support of the Justice40 initiative to direct Federal investments to disadvantaged communities. The tool may help specify funding criteria, implementation requirements , and evaluation of the initiative’s successes and shortcomings.
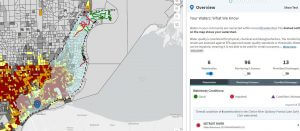
Other federal tools that focus more on water data also hold potential to illuminate climate and environmental justice concerns. EPA’s “How’s My Waterway?” mapping tool includes vast water quality data and can be layered with demographic data. The EPA’s Enforcement and Compliance History Online (ECHO) website enables users to assess their community’s water facilities for compliance with environmental regulations and now includes environmental justice metrics, including the ability to:
- Search for Facilities in Areas with Possible EJ Concerns
- Investigate Pollution Sources in Areas with Possible EJ Concerns
- Examine and Create EJ Enforcement-Related Maps
- Analyze Trends in Compliance & Enforcement EJ Data
Curious how integrated water management planning can incorporate equity with the assistance of data-driven tools? Read more about EPA’s Recovery Potential Screening (RPS) tool here.
State-level Mapping Tools
States continue to develop their own mapping tools to provide information on environmental health, variously describing communities as “overburdened,” “disadvantaged,” “frontline” or as “EJ communities.” Indicators related to water tend to be more sparsely available compared to those related to air pollution. Providing feedback to both federal and state agencies about what indicators are needed will hopefully improve future iterations.
Explore the table below for an at-a-glance comparison across the tools. If your state has an environmental justice mapping tool that’s not included here, please let us know!


